Trade-offs: Accuracy and interpretability, bias and variance
Dr. D’Agostino McGowan
Classification
Notation
- YY is the response variable. It is qualitative
- C(X)C(X) is the classifier that assigns a class CC to some future unlabeled observation, XX
Notation
- YY is the response variable. It is qualitative
- C(X)C(X) is the classifier that assigns a class CC to some future unlabeled observation, XX
- Examples:
- Email can be classified as C=(spam, not spam)
- Written number is one of C={0,1,2,…,9}
Classification Problem
What is the goal?
Classification Problem
What is the goal?
- Build a classifier C(X) that assigns a class label from C to a future unlabeled observation X
- Assess the uncertainty in each classification
- Understand the roles of the different predictors among X=(X1,X2,…,Xp)
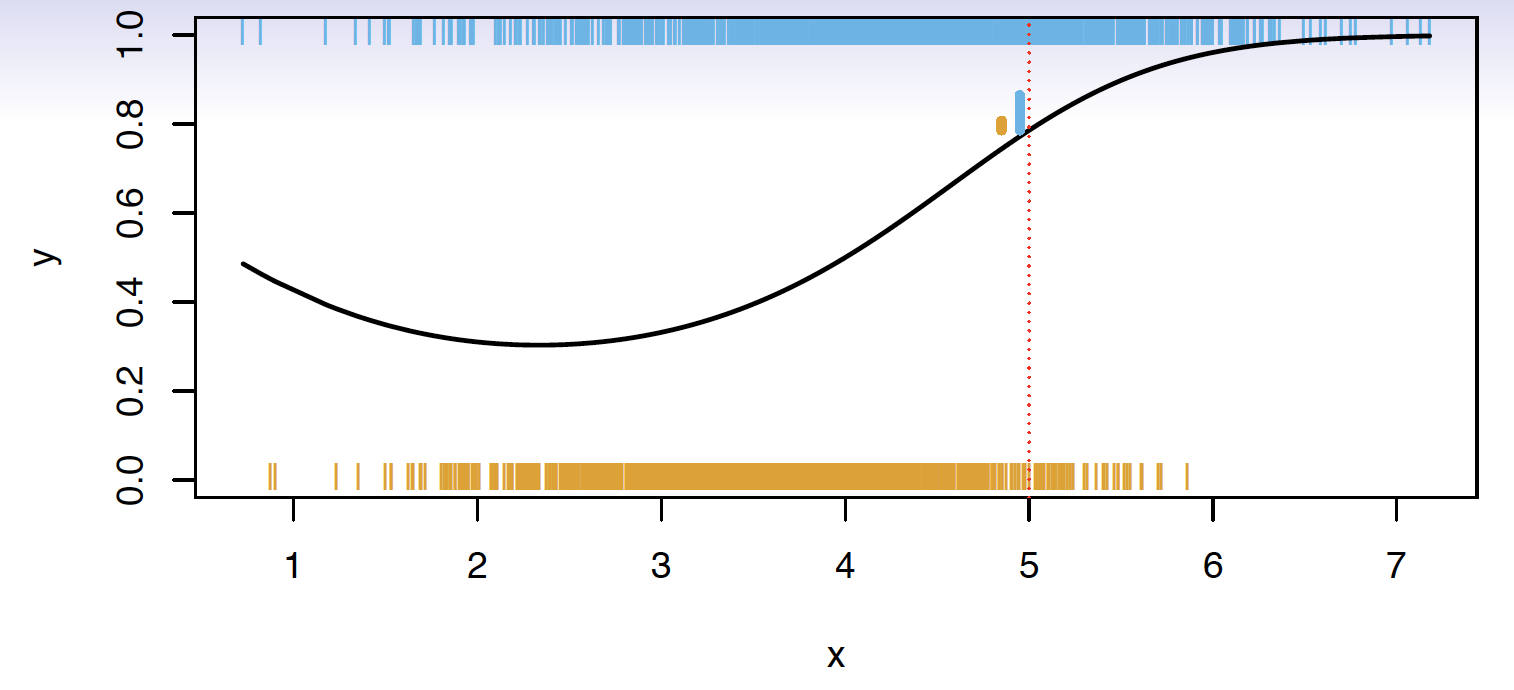
Suppose there are K elements in C, numbered 1,2,…,K
pk(x)=P(Y=k|X=x),k=1,2,…,K These are conditional class probabilities at x

Suppose there are K elements in C, numbered 1,2,…,K
pk(x)=P(Y=k|X=x),k=1,2,…,K These are conditional class probabilities at x
How do you think we could calculate this?

Suppose there are K elements in C, numbered 1,2,…,K
pk(x)=P(Y=k|X=x),k=1,2,…,K These are conditional class probabilities at x
How do you think we could calculate this?
- In the plot, you could examine the mini-barplot at x=5

Suppose there are K elements in C, numbered 1,2,…,K
pk(x)=P(Y=k|X=x),k=1,2,…,K These are conditional class probabilities at x
- The Bayes optimal classifier at x is
C(x)=j if pj(x)=max{p1(x),p2(x),…,pK(x)}
- Notice that probability is a conditional probability
- It is the probability that Y equals k given the observed preditor vector, x
- Let's say we were using a Bayes Classifier for a two class problem, Y is 1 or 2. We would predict that the class is one if P(Y=1|X=x0)>0.5 and 2 otherwise
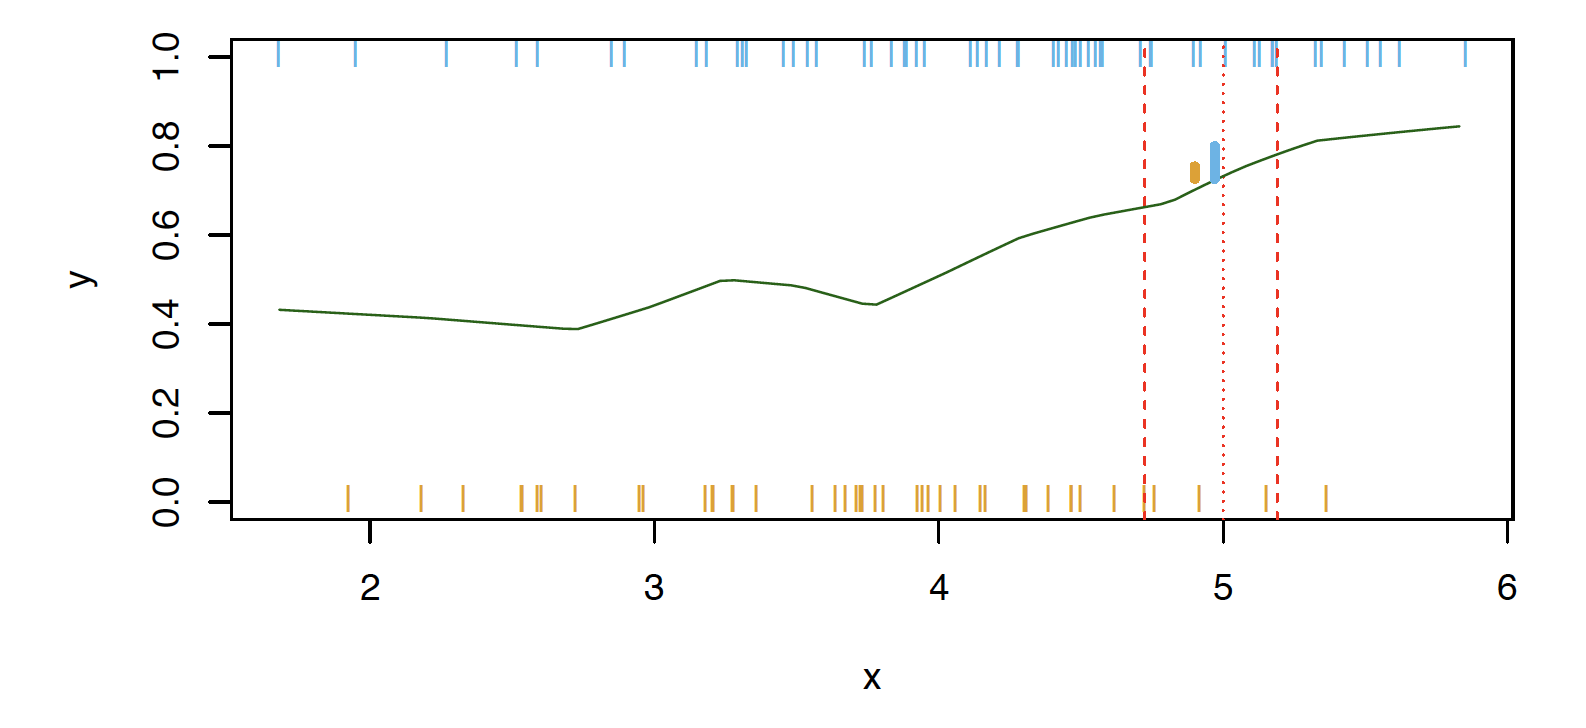
What if this was our data and there were no points at exactly x=5? Then how could we calculate this?

What if this was our data and there were no points at exactly (x = 5)? Then how could we calculate this?
- Nearest neighbor like before!

What if this was our data and there were no points at exactly (x = 5)? Then how could we calculate this?
- Nearest neighbor like before!
- This does break down as the dimensions grow, but the impact of ˆC(x) is less than on ˆpk(x),k=1,2,…,K
Accuracy
- Misclassification error rate
Errtest=Avei∈testI[yi≠ˆC(xi)]
Accuracy
- Misclassification error rate
Errtest=Avei∈testI[yi≠ˆC(xi)]
- The Bayes Classifier using the true pk(x) has the smallest error
Accuracy
- Misclassification error rate
Errtest=Avei∈testI[yi≠ˆC(xi)]
- The Bayes Classifier using the true pk(x) has the smallest error
- Some of the methods we will learn build structured models for C(x) (support vector machines, for example)
Accuracy
- Misclassification error rate
Errtest=Avei∈testI[yi≠ˆC(xi)]
- The Bayes Classifier using the true pk(x) has the smallest error
- Some of the methods we will learn build structured models for C(x) (support vector machines, for example)
- Some build structured models for pk(x) (logistic regression, for example)
- the test error rate Avei∈testI[yi≠ˆC(xi)] is minimized on average by very simple classifier that assigns each observation to the most likely class, given its predictor values (that's the Bayes classifier)
K-Nearest-Neighbors example
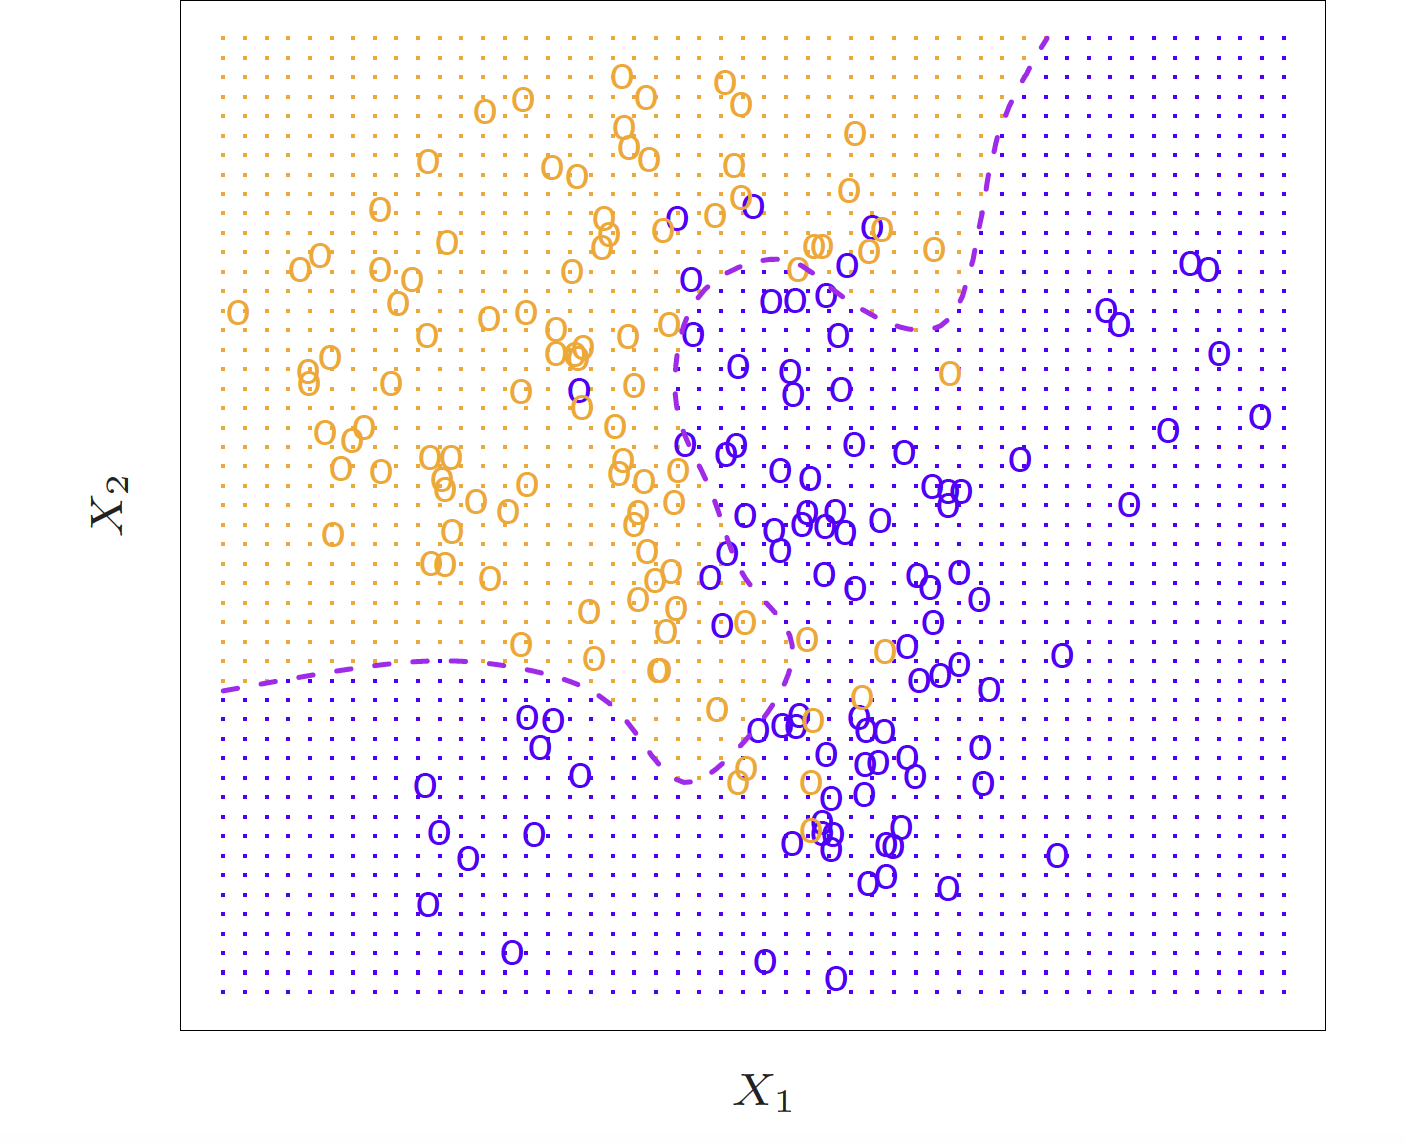
- Here is a simulated dataset of 100 observations in two groups, blue and orange
- The purple dashed line represents the Bayes decision boundary
- The orange background grid indicates the region where the test observations will be classified as orange, and the blue for the blue
- We'd love to be able to use the Bayes classifier to but for real data, we don't know the conditional distribution of Y given X so computing the Bayes classifier is impossible
- Alot of methods try to estimate the conditional distribution of Y given X and then classify a given observation to the class with the highest estimated probability
- One method to do this is K-nearest neighbors
KNN (K = 10)
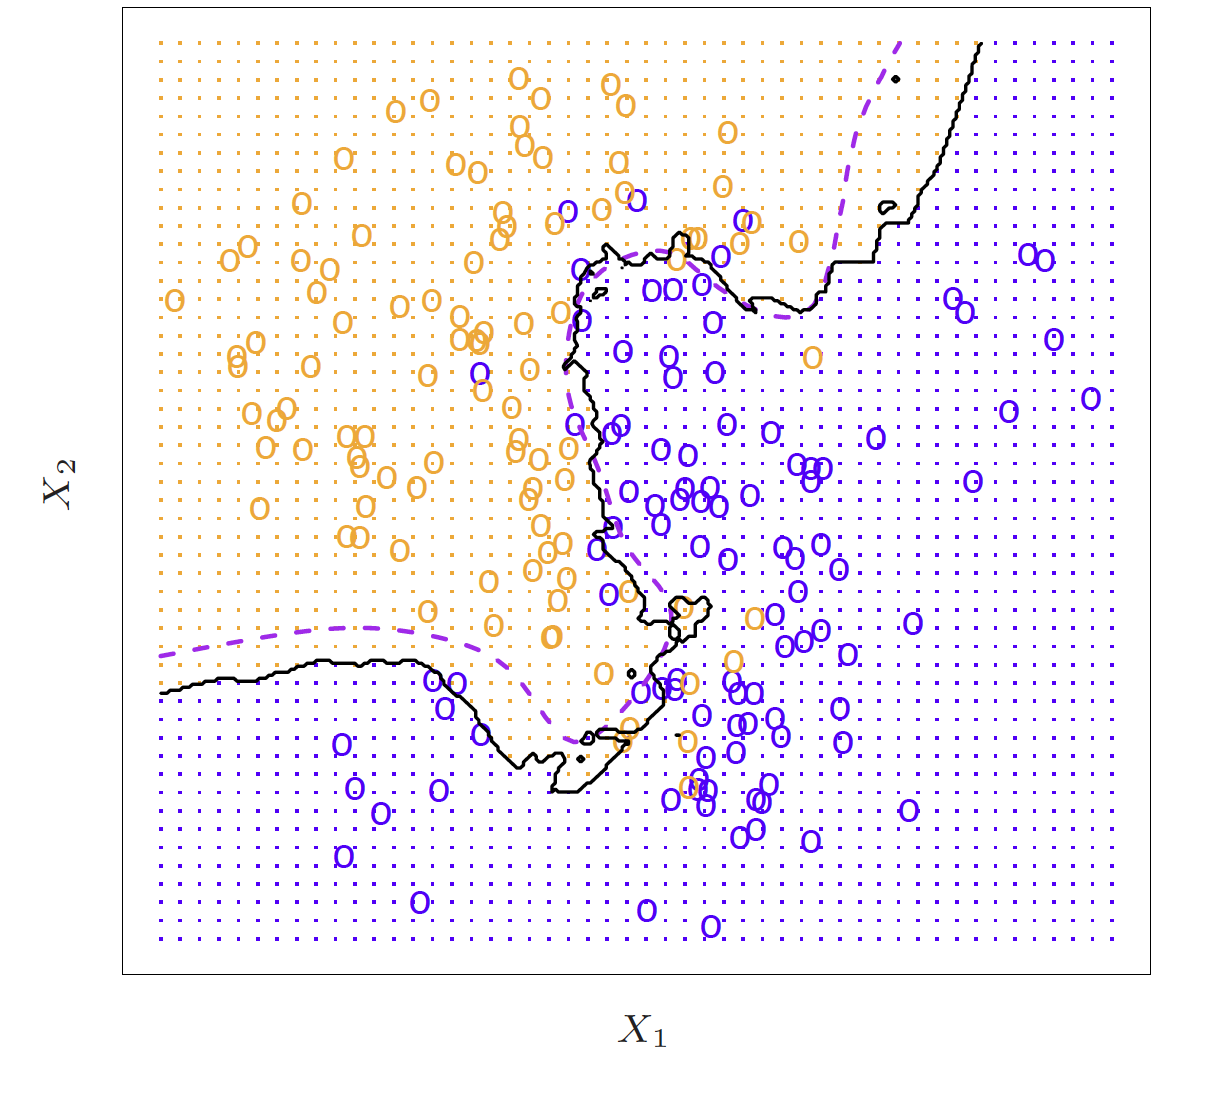
- Again, the way KNN works is if K = 10, it is finding the 10 closest observations and calculating the probability of being orange or blue and will classify that point as such
- So here is an example of K nearest neighbors where K is 10
KNN
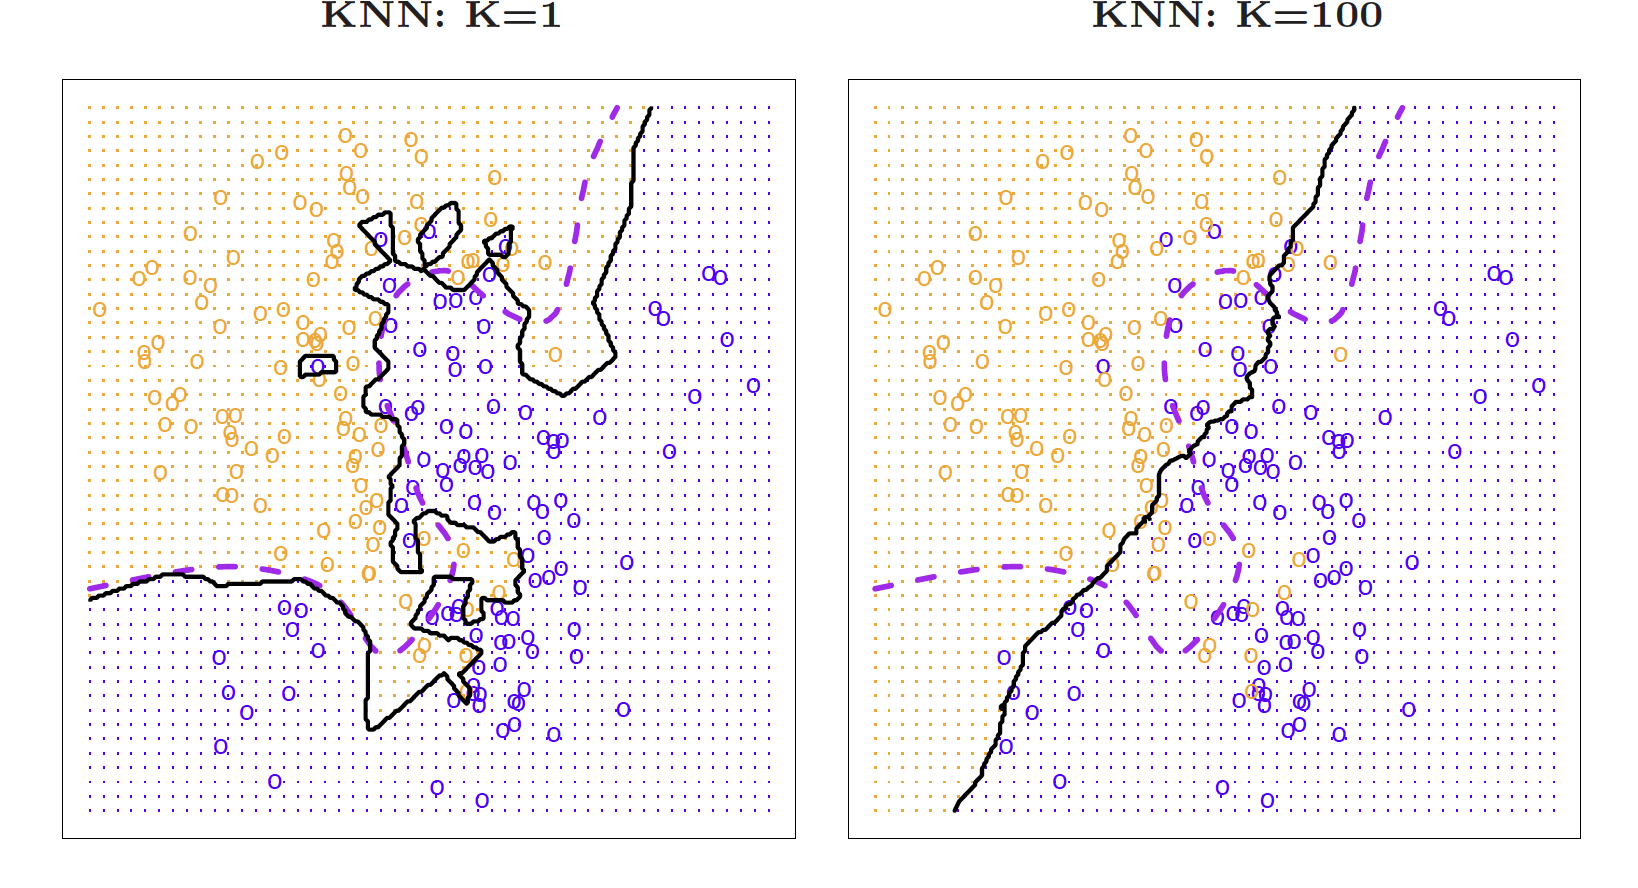
- Because this dataset has 100 data points, K can range from 1 to 100 where at 1, the error rate in the TRAINING data will be 0 but the test error rate may be really high. So we are trying to find the happy medium. The test error is going to have that same u-shape relationship, you want to find the bottom of that U
Trade-offs
